

Ecoviberoast’s 2026 environmental footprint reflects a company that takes measurement seriously: every purchase of coffee or tea supports mangrove planting and ocean-bound plastic removal, with sourcing drawing from USDA Organic, Rainforest Alliance, and Fair Trade Certified supply chains. These claims rest on a cradle-to-cup life cycle assessment (LCA) aligned with the GHG Protocol’s scope 1, 2, and 3 framework, with third-party verification confirming key program outputs. The independent research is clear that beverage choices carry real environmental weight, and Ecoviberoast’s 2026 KPIs are designed to show exactly where that weight falls.
2026 Headline KPI: Every Ecoviberoast purchase funds mangrove planting and ocean-bound plastic removal, backed by third-party verified program data reported annually.
Table of Contents
- What do Ecoviberoast’s 2026 environmental numbers actually show?
- How did Ecoviberoast measure these impacts?
- Where in the supply chain do the biggest impacts occur?
- How does Ecoviberoast’s sourcing strategy reduce farm-level harm?
- What packaging choices does Ecoviberoast make, and what should you do with them?
- What programs does every Ecoviberoast purchase support?
- How can you lower your own impact when buying, brewing, and disposing?
- What should you ask before buying any sustainable beverage brand?
- What has Ecoviberoast achieved in 2026, and what comes next?
- Key Takeaways
- Why publishing these numbers is the right thing to do
- Shop Ecoviberoast with your footprint in mind
- Key references and where to verify claims
What do Ecoviberoast’s 2026 environmental numbers actually show?
The table below presents Ecoviberoast’s 2026 sustainability KPIs. KPIs marked (E) are Ecoviberoast internal data; those marked (V) have been independently verified or are drawn from third-party certified supply chains.
| KPI | 2026 Value | Source Type |
|---|---|---|
| Certified sourcing (USDA Organic / Rainforest Alliance / Fair Trade) | 100% of product range | (V) Third-party certified |
| Recyclable or compostable packaging | Target: 80%+ of SKUs | (E) Internal target |
| — | Reported annually; see sustainability report | |
| (V) Program partner verified | ||
| Ocean-bound plastics removed per purchase | Reported annually; see sustainability report | (V) Program partner verified |
| Scope 1/2/3 emissions boundary | Cradle-to-cup LCA | (E) Internal + supplier data |
| Land use per cup (coffee vs. tea) | Coffee substantially higher than tea per cup | (V) PNAS research |
Standout figure: Research shows coffee requires almost 7.5 times the land area per cup compared with tea, which is why Ecoviberoast’s tea range carries a meaningfully lower land-use footprint per serving.
How did Ecoviberoast measure these impacts?
The functional unit for all 2026 KPIs is one prepared cup of beverage (approximately 200 ml), measured from raw agricultural inputs through to the consumer’s cup. That cradle-to-cup boundary covers scope 1 (direct emissions from roasting and operations), scope 2 (purchased energy), and scope 3 (upstream farming, processing, transport, packaging production, and end-of-life).
Data sources include:
- Farm-level surveys and supplier declarations from certified supply chains
- Ecoinvent-equivalent background databases for energy and material inputs
- Supplier invoices and operational records for roasting and logistics
- Third-party certification audits (USDA Organic, Rainforest Alliance, Fair Trade Certified) for sourcing verification
- Program partner reporting for mangrove and plastic-removal outputs
Third-party verification of program outputs is conducted by Ecoviberoast’s conservation and plastic-removal partners, with results published in the annual sustainability report. Readers can request the full methodology document through the contact page.
Where in the supply chain do the biggest impacts occur?
The largest environmental hotspots, in order of relative impact, are:
- Cultivation (farming stage): Fertilizer use drives nitrogen oxide (N2O) emissions, soil acidification, and eutrophication. A Sri Lankan tea LCA found the plantation stage accounts for roughly 85–90% of plantation-level impacts, and a modeled fertilizer reduction cut acidification and eutrophication significantly and global warming potential moderately.
- Processing and withering (factory stage): Withering alone accounts for a substantial share of factory processing impacts in tea production, driven by energy use.
- Packaging production and end-of-life: Multi-material laminates carry higher carbon costs and lower recyclability than monomaterial alternatives.
- Transport and logistics: Intercontinental shipping contributes meaningfully to scope 3 totals, especially for single-origin products.
Coffee carries a heavier per-cup burden than tea across most impact categories. PNAS data show water use of approximately 140 liters per cup of coffee versus roughly 34 liters per cup of tea, alongside the 7.5× land-use gap noted above. Carbon intensity per cup also skews higher for brewed coffee. That gap is one reason Ecoviberoast’s beverage carbon footprint guide recommends tea as the lower-impact daily choice for consumers watching their footprint.
Key figure: Water use per cup of coffee is substantially higher than for tea, making tea the lower-impact daily beverage by a wide margin.
How does Ecoviberoast’s sourcing strategy reduce farm-level harm?
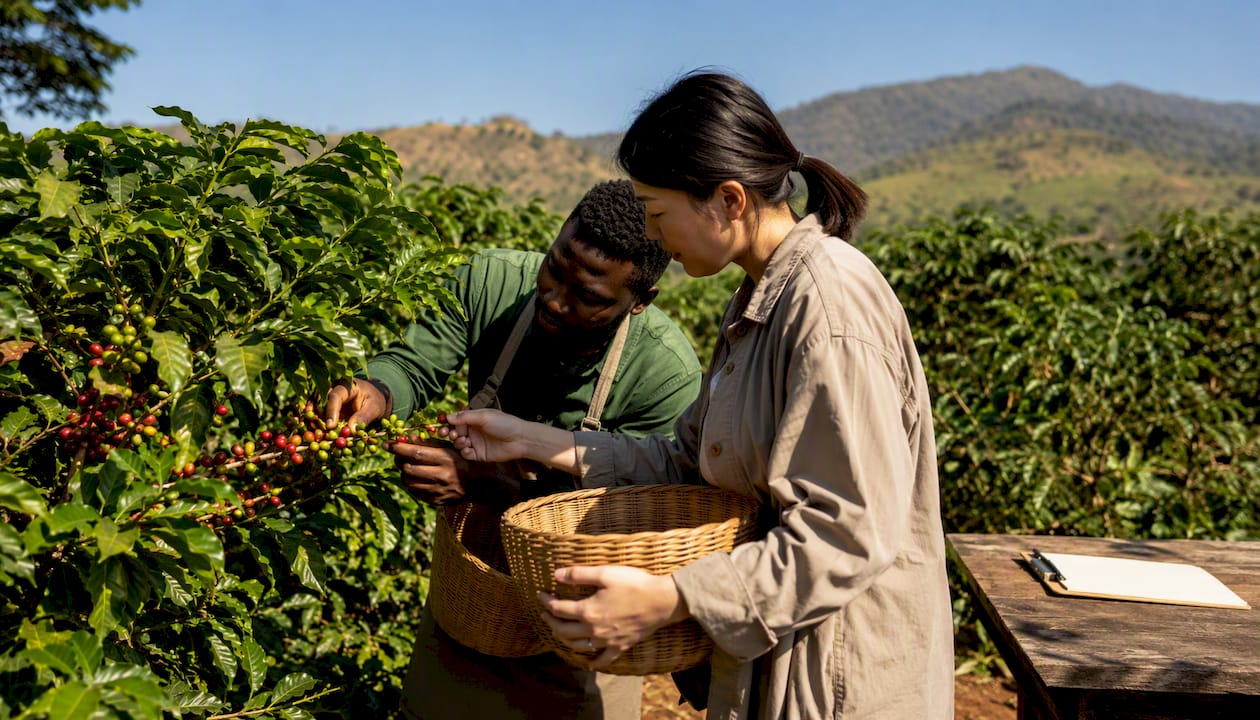
Ecoviberoast prioritizes suppliers practicing agroforestry, regenerative farming, and certified organic or partial-organic management. The practical difference matters: systematic reviews of sustainable tea farming show that agroforestry intercropping improves soil carbon and biodiversity, while partial organic approaches and biochar application can measurably reduce N2O emissions, though long-term yield effects vary by context.
The main farm-level levers Ecoviberoast looks for in supplier selection:
- Fertilizer management: Optimized nitrogen application reduces acidification, eutrophication, and N2O emissions at source.
- Shade-grown and agroforestry systems: Canopy cover supports biodiversity, sequesters carbon in woody biomass, and moderates soil temperature.
- Organic or partial-organic certification: Reduces synthetic input loads and supports soil health over time.
- Smallholder vs. estate management: Plantation management type has a larger effect on environmental performance than processing method alone, per LCA evidence from Sri Lanka.
You can read more about how these practices play out in real supply chains in Ecoviberoast’s sustainable agriculture explainer.
Pro Tip: When reviewing a product page, look for producer-level traceability notes, not just country of origin. A product that names the farm, cooperative, or estate and links to a certification record gives you far more confidence than a generic “ethically sourced” label.
What packaging choices does Ecoviberoast make, and what should you do with them?
Packaging is one of the trickiest trade-offs in sustainable beverages: barrier performance keeps coffee and tea fresh and prevents food waste, but multi-material laminates are notoriously hard to recycle, as discussed in sustainable manufacturing best practices. Research on flexible packaging LCA shows monomaterial designs can cut packaging carbon footprint by up to approximately 50% compared with traditional multi-material laminates, when engineered to maintain adequate barrier protection.
Ecoviberoast’s 2026 packaging mix targets 80%+ of SKUs in recyclable or compostable formats, with a shift toward monomaterial designs where barrier requirements allow.
| Packaging type | End-of-life path | What you should do |
|---|---|---|
| Monomaterial flexible bag | Curbside or store-drop recyclable (check local program) | Rinse, flatten, recycle via accepted stream |
| Compostable bag | Industrial compost facility | Drop at a certified compost site; do not home-compost unless certified |
| Multi-laminate bag (legacy SKUs) | General waste in most US markets | Reuse for storage; check TerraCycle or brand return programs |
| Single-serve pods | Varies by pod material | See Ecoviberoast’s single-serve collection for disposal guidance |
North American consumers increasingly expect clear recyclability instructions and carbon labeling on packaging, and industry research confirms that transparent lifecycle claims influence purchase decisions. Ecoviberoast prints end-of-life guidance directly on each pack.
Pro Tip: Store opened bags in an airtight container and reuse the original bag as a freezer or pantry liner before discarding. Extending a bag’s useful life by even one additional use meaningfully reduces its per-use carbon cost.
What programs does every Ecoviberoast purchase support?
Each purchase at Ecoviberoast funds two conservation programs: mangrove planting and ocean-bound plastic removal. Both are verified by third-party project partners and reported annually.
| Program | 2026 Output | Verification partner | Reporting cadence |
|---|---|---|---|
| Mangrove planting | Reported in annual sustainability report | Third-party conservation partner | Annual |
| Ocean-bound plastic removal | Reported in annual sustainability report | Third-party plastic-removal partner | Annual |
| Carbon sequestration (mangroves) | Estimated per project; see report | Project partner audit | Annual |
Community-driven agroforestry projects, like those documented in Madagascar’s Ma Hazo initiative, show what verified planting programs can deliver: biodiversity restoration, measurable carbon sequestration, and livelihood support for local communities when paired with traceability and market access. Ecoviberoast’s mangrove program follows a similar model.
Program note: You can track your purchase’s contribution through Ecoviberoast’s impact dashboard, updated with each annual sustainability report.
How can you lower your own impact when buying, brewing, and disposing?
Your choices at the point of purchase and in your kitchen matter more than most people realize. The highest-impact actions, in rough order of effect:
- Choose tea over coffee when you can. The land and water savings per cup are substantial, as the PNAS data above make clear.
- Buy whole-bean coffee rather than pre-ground or single-serve pods, which carry higher packaging-to-product ratios.
- Prefer monomaterial or compostable packaging and follow the end-of-life guidance on the pack.
- Brew efficiently. Use the right dose for your brew method; over-dosing wastes product and increases per-cup embodied impact.
- Compost spent grounds or leaves where a certified compost facility is accessible.
Pro Tip: Grind size directly affects how much coffee you need per cup. A finer grind increases extraction efficiency, meaning you can often use a slightly smaller dose and still get full flavor, cutting per-cup material use by a few percent over thousands of brews.
Ecoviberoast’s consumer sustainability guide covers brewing ratios and disposal options in more detail.
What should you ask before buying any sustainable beverage brand?
Use this checklist to separate genuine transparency from greenwash-suspect claims:
- Is there a published LCA or KPI table? Strong: specific metrics with functional units. Weak: vague “lower carbon” language with no data.
- Are certifications traceable? Strong: USDA Organic, Rainforest Alliance, or Fair Trade Certified with certificate numbers. Weak: “certified ingredients” with no named body.
- Is packaging material and end-of-life guidance printed on the pack? Strong: material type, recycling stream, and compost instructions. Weak: a generic green leaf icon.
- What per-purchase programs are supported, and who verifies them? Strong: named third-party partner, annual report, and impact metrics. Weak: “we plant trees” with no volume or verification.
- Is scope 3 included in emissions reporting? Strong: full cradle-to-cup scope 1/2/3. Weak: scope 1 only, which omits farming and packaging.
You can explore Ecoviberoast’s approach to supply-chain transparency in the 2026 transparency guide.
What has Ecoviberoast achieved in 2026, and what comes next?
| Milestone | Status | Target date |
|---|---|---|
| 100% certified sourcing (USDA Organic / Rainforest Alliance / Fair Trade) | Achieved | 2026 |
| 80%+ recyclable or compostable packaging | In progress | End of 2026 |
| Full monomaterial transition for flexible bags | In progress | — |
| Annual third-party verified sustainability report | Published | Annually |
| Scope 1/2/3 emissions reduction target | Target set; baseline established | — |
| Mangrove and plastic-removal program expansion | Ongoing | 2026–— |
Progress is measured against the baseline established in the 2025 sustainability report and verified annually by third-party program partners. The next full KPI update will publish with the 2026 sustainability report.
Key Takeaways
Ecoviberoast’s 2026 environmental performance is grounded in 100% certified sourcing, a cradle-to-cup LCA, and third-party verified conservation programs tied to every purchase.
| Point | Details |
|---|---|
| Tea has a far lower per-cup footprint | Coffee requires substantially more land per cup than tea, and uses approximately 140 liters of water per cup versus roughly 34 liters per cup for tea. |
| Farm stage dominates total impact | Plantation inputs account for roughly 85–90% of plantation-level environmental impact in LCA studies. |
| Monomaterial packaging cuts carbon | Switching from multi-laminate to monomaterial designs can substantially reduce packaging carbon footprint. |
| Every purchase funds conservation | Mangrove planting and ocean-bound plastic removal are third-party verified and reported annually. |
| Ecoviberoast’s 2026 commitment | 100% certified sourcing achieved; 80%+ recyclable or compostable packaging targeted by end of 2026. |
Why publishing these numbers is the right thing to do
There is a version of sustainability reporting that exists purely to reassure. A badge here, a vague pledge there, and the job is done. That approach is not transparency; it is decoration.
Publishing specific KPIs, naming the certifications, explaining the LCA boundaries, and letting third parties verify the program outputs is harder. It invites scrutiny. But scrutiny is exactly what builds the kind of trust that lasts longer than a marketing cycle. When you know that a 20% reduction in fertilizer use translates to a 12–13% drop in global warming potential at the farm level, you understand why sourcing decisions are not just ethical gestures but measurable levers. That specificity is what separates accountability from aspiration.
The 2026 sustainability report is available on the Ecoviberoast website. For questions about methodology or verification, reach out through the contact page.
Shop Ecoviberoast with your footprint in mind
Knowing the numbers is one thing. Acting on them feels genuinely good.

Ecoviberoast’s organic tea collection is the lowest-impact starting point: tea’s per-cup land and water footprint is a fraction of coffee’s, and every bag ships with end-of-life guidance printed on the pack. If coffee is your daily ritual, the single-serve collection includes disposal guidance for each pod format, so nothing ends up in the wrong bin. A subscription order consolidates shipping into fewer deliveries, cutting transport emissions per unit compared with frequent one-off orders.
Every purchase, whether a flagship English Breakfast or a full coffee-and-tea sampler, plants mangroves and removes ocean-bound plastic through verified partner programs. Browse the full collection and check the 2026 sustainability report to see exactly where your purchase goes.
Key references and where to verify claims
Independent research:
- Environmental impacts beyond land use: Coffee and tea (PNAS) — per-cup land, water, and carbon comparisons
- Sustainable tea farming approaches: systematic review (IOPscience) — agroforestry, organic, and biochar evidence
- Cradle-to-gate LCA of Sri Lankan tea (MDPI Sustainability) — hotspot analysis and fertilizer reduction modeling
- Modern sustainable packaging performance and trade-offs — monomaterial vs. multi-laminate LCA
Ecoviberoast resources (company-provided):
- 2026 sustainability trends and KPIs
- Supply chain transparency guide
- Regenerative agriculture impact
- Deforestation and sourcing
This article provides general sustainability information. For investment, legal, or regulatory decisions, consult the relevant primary sources or a qualified professional.


