
TL;DR:
- A single cup of coffee emits about 0.28 kg CO2e, primarily from farming and processing.
- Beverages’ carbon footprints include stages from agriculture to disposal, with upstream factors dominating emissions.
- Choosing plant-based milks, responsible sourcing, and energy-efficient brewing significantly reduces your beverage carbon impact.
Your morning cup of coffee and your afternoon mug of tea might feel equally simple, but their environmental stories are worlds apart. A single cup of coffee emits roughly 0.28 kg CO2e, while a comparable serving of tea clocks in at just 0.014 kg CO2e. That’s a staggering difference hiding in plain sight. Most people focus on packaging when they think about beverage sustainability, but packaging is only a small piece of the puzzle. The real story involves farms, fertilizers, processing plants, and even how you brew your drink at home. Understanding beverage carbon footprints gives you the power to make choices that genuinely move the needle for our planet.
Table of Contents
- What is a beverage carbon footprint?
- How is carbon footprint measured for beverages?
- Coffee vs tea: A carbon footprint comparison
- What influences the carbon footprint of your drink?
- How to choose lower-carbon beverages
- The surprising truth about beverage carbon footprints
- Choose eco-minded beverages with EcoVibe Roast
- Frequently asked questions
Key Takeaways
| Point | Details |
|---|---|
| Carbon footprint defined | It measures all greenhouse gas emissions from farm to shelf or cup in CO2 equivalents. |
| Coffee vs tea emissions | A cup of tea produces far fewer emissions than coffee—about 30 times less. |
| Major impact factors | Agriculture, processing, and energy use drive most of a beverage’s footprint. |
| Reduce your impact | Opt for plant-based, local, and shade-grown options, and minimize energy use when brewing. |
| Focus beyond packaging | While packaging matters, lifecycle stages like sourcing and brewing have a much larger impact. |
What is a beverage carbon footprint?
Now that you have a sense of why beverage carbon footprints matter, let’s dig into how this footprint is actually defined and calculated.
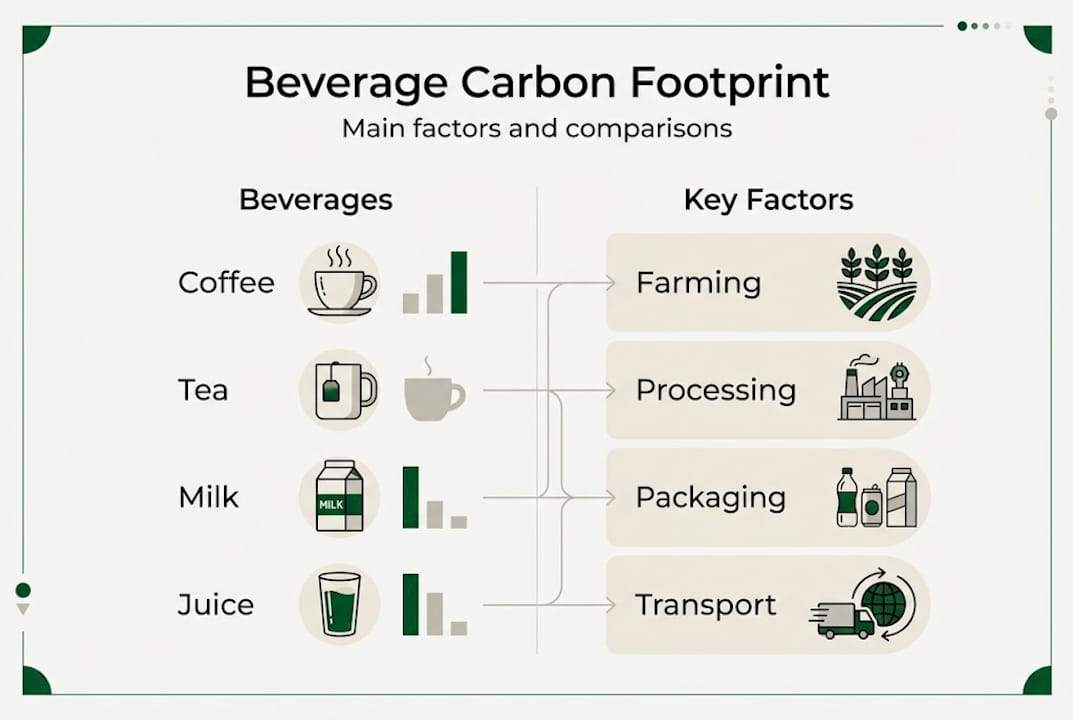
A beverage carbon footprint is the total amount of greenhouse gas emissions generated across a drink’s entire life, from the moment seeds go into the ground to the moment the empty container hits the recycling bin. These emissions are measured in kilograms of CO2 equivalent, or kg CO2e, a unit that accounts for multiple greenhouse gases like methane and nitrous oxide by converting them into their carbon dioxide equivalent. It’s a single, comparable number that lets you weigh one drink against another.
According to established carbon accounting frameworks, the full life cycle of a beverage includes these key stages:
- Agriculture: Growing the raw ingredient, including land use, fertilizers, irrigation, and farm machinery
- Processing: Roasting coffee beans, drying tea leaves, blending, or fermenting
- Packaging: Producing cans, bags, pods, or cartons and filling them
- Transport: Moving goods from farms to processors, then to distributors and retailers
- Use: Energy consumed during brewing or preparation at home
- Disposal: Composting, recycling, or landfilling the packaging and leftover product
Most scientific studies use what’s called a “cradle-to-gate” boundary, which means they measure emissions from farming all the way through to when the product reaches the store shelf. This approach is practical and widely used, but it does leave out the brewing and disposal stages, which can actually be significant for some beverages.
“The carbon footprint of a beverage covers the total greenhouse gas emissions from the product’s full life cycle, including agriculture, processing, packaging, transport, and sometimes consumption and disposal.”
Why does this matter for you? Because it means that the impact of packaging choices, while important, is rarely the dominant factor. Agriculture and processing typically account for the lion’s share of emissions. If you’re only thinking about whether a bottle is recyclable, you’re missing the bigger picture.
How is carbon footprint measured for beverages?
With the definition established, it’s crucial to understand how these numbers are actually put together and what methodologies are behind them.
The gold standard for measuring a beverage’s carbon footprint is Life Cycle Assessment, or LCA. This is a structured methodology that tracks every input and output across a product’s life stages. LCA studies on beverages follow internationally recognized protocols to make results comparable and credible.
The three most widely used standards are:
- ISO 14067: An international standard specifically for quantifying and communicating product carbon footprints. It provides rigorous rules for system boundaries and data quality.
- GHG Protocol Product Standard: Developed by the World Resources Institute, this framework is widely adopted by corporations and is flexible enough to cover complex global supply chains.
- PAS 2050: A British standard that was one of the first to focus specifically on product-level carbon footprints and is still referenced in many food and beverage studies.
As LCA methodologies show, most beverage studies use a cradle-to-gate approach, measuring from farm to grocery store. Cradle-to-grave goes further, adding consumer use and end-of-life disposal. The choice of boundary significantly affects the final number, so always check which approach a study uses before comparing figures.
Pro Tip: When reading carbon footprint claims on a product label, look for the standard used and whether it’s cradle-to-gate or cradle-to-grave. A cradle-to-grave figure will always be higher and is the more complete picture.
One critical concept here is Scope 3 emissions. These are indirect emissions that occur in a company’s supply chain but outside its direct operations, like the fertilizer a farmer uses or the energy a consumer burns brewing their morning cup. For most beverages, Scope 3 emissions dominate the total footprint, sometimes accounting for over 80% of all emissions. This is why sustainable packaging guidance and circular economy practices are valuable, but upstream choices matter even more.
Coffee vs tea: A carbon footprint comparison
Knowing how the numbers are calculated helps make sense of the large differences you might see between your favorite beverages.
The contrast between coffee and tea is genuinely eye-opening. Roasted coffee carries a footprint of roughly 17 kg CO2e per kilogram, while a single brewed cup lands at about 0.28 kg CO2e. Tea, by comparison, is dramatically lighter on the planet. A 330ml serving of tea produces just 0.014 kg CO2e, compared to 0.4 kg for the same volume of coffee. In fact, tea emits about 30 times less CO2e per serving than coffee, and about 12 times less than soda.

| Beverage | Per kg CO2e | Per serving CO2e |
|---|---|---|
| Roasted coffee | ~17 kg | ~0.28 kg |
| Green (unroasted) coffee | ~3.6 kg | ~0.07 kg |
| Black tea | ~1.5 kg | ~0.014 kg |
| Soda (carbonated drink) | ~0.5 kg per liter | ~0.17 kg (330ml) |
So why is coffee so much more carbon-intensive? Several factors stack up:
- Roasting energy: Coffee beans require significant heat energy during roasting, a stage tea leaves largely skip
- Processing intensity: Wet-processing coffee (the washing method) uses large volumes of water and generates organic waste
- Yield per hectare: Coffee plants produce far less usable product per unit of land than tea plants, meaning more resources per cup
- Land use change: Coffee farming has historically driven deforestation in tropical regions, adding land-use emissions to the tally
Pro Tip: Choosing shade-grown coffee, which is grown under a forest canopy rather than in cleared land, can meaningfully reduce the land-use portion of your coffee’s footprint. Look for the environmental impact of coffee production when evaluating brands, and explore eco-friendly tea selection if you want to shift toward lower-carbon sipping. You can also explore tea’s carbon footprint in depth through recent research.
What influences the carbon footprint of your drink?
Understanding the numbers is one thing, but what actually causes some drinks to emit more than others?
The answer lies in a chain of decisions made long before your kettle boils. Key contributors include agriculture, processing, transport, and the Scope 3 emissions woven throughout the supply chain. Here’s what moves the needle most:
- Fertilizer use: Nitrogen-based fertilizers release nitrous oxide, a greenhouse gas roughly 300 times more potent than CO2
- Land use and deforestation: Converting forests to farmland releases stored carbon and removes future carbon sinks
- Processing energy: Roasting, drying, and milling all require energy, and the source of that energy matters enormously
- Transport distance: Beans or leaves traveling from Ethiopia or Sri Lanka to your kitchen carry significant shipping emissions
- Brewing method: An electric kettle on a renewable energy grid is far cleaner than a gas-powered espresso machine
- Add-ins: Dairy milk can more than double the footprint of a single cup
| Drink preparation | Approximate CO2e per serving |
|---|---|
| Black coffee (drip brewer) | ~0.28 kg |
| Coffee with dairy milk | ~0.55 kg |
| Coffee with oat milk | ~0.32 kg |
| Black tea | ~0.014 kg |
| Tea with dairy milk | ~0.20 kg |
“Choosing responsible sourcing and sustainable agriculture practices for coffee and tea farming is one of the most powerful levers for reducing beverage emissions.”
The table above shows just how much your preparation habits shape your daily footprint. Swapping dairy milk for oat milk in your coffee saves roughly 0.23 kg CO2e per cup. Multiply that by 365 days and you’re looking at a meaningful annual reduction.
How to choose lower-carbon beverages
With the biggest influences now clear, you can use this knowledge to make practical, lower-impact beverage choices.
The good news is that small, consistent changes add up fast. Here are the most impactful steps you can take:
- Switch to plant-based milk: Oat, almond, and soy milk all carry significantly lower footprints than dairy. Oat milk is a crowd favorite for its creamy texture and low emissions.
- Choose shade-grown or certified coffee: Look for Rainforest Alliance or Bird Friendly certifications, which signal lower land-use impact and better biodiversity outcomes.
- Brew efficiently: Use only as much water as you need, and opt for an eco-friendly coffee brewing method like a French press or pour-over, which avoids single-use filters and uses minimal energy.
- Prioritize local or regional sourcing: When possible, choose brands that source closer to home or that offset long-haul transport emissions through verified programs.
- Drink more tea: On days when you want a lower-carbon option, a cup of black or herbal tea is one of the lightest choices you can make.
Pro Tip: The carbon footprint of food research is clear that milk additions multiply your drink’s footprint faster than almost any other single variable. Cutting dairy from just one daily coffee can save over 80 kg CO2e per year.
Looking for brands that walk the talk? Explore resources on supporting eco-friendly coffee and tea and discover the benefits of eco-friendly teas for both your health and the planet. These aren’t just feel-good choices. They’re measurable, science-backed actions that compound over time.
The surprising truth about beverage carbon footprints
Stepping back, it’s worth pausing to question some common assumptions and look at what really makes a difference.
Here’s something most sustainability conversations get wrong: they fixate on packaging. Reusable cups, compostable pods, paper straws. These matter, but they’re not where the bulk of emissions live. For coffee, well over 80% of total emissions happen before the product ever reaches a store shelf. That means the farm, the processing facility, and the shipping container are doing far more climate damage than the bag your beans arrive in.
The most powerful changes you can make happen at the sourcing and preparation stage. Choosing responsibly sourced coffee and tea, skipping dairy milk, and using an energy-efficient brewer will outperform any packaging swap by a wide margin. We’re not saying packaging doesn’t matter. It does. But if you spend all your energy debating paper versus plastic and ignore what’s in your cup and where it came from, you’re optimizing the wrong thing. Focus upstream first, then refine the details.
Choose eco-minded beverages with EcoVibe Roast
Inspired to lower your beverage footprint? Here’s how EcoVibe Roast can help you take the next step.
At EcoVibe Roast, every product is chosen with the planet in mind. From our responsibly sourced single-serve coffee pods to our aromatic jasmine green tea, we make it easy to sip with intention. Each purchase supports real environmental action, including planting mangrove trees and removing ocean-bound plastics.

You don’t have to choose between a great-tasting cup and a cleaner planet. Explore our full range and learn more about our environmental impact efforts to see exactly how your purchase makes a difference. Every cup is a small act of care for Mother Earth, and those acts add up beautifully.
Frequently asked questions
What does ‘cradle-to-gate’ mean in beverage carbon footprint?
Cradle-to-gate measures emissions from raw material production up to the retail shelf, excluding what happens when you brew or dispose of the product. It’s the most commonly used boundary in food and beverage LCA studies.
How much carbon does a cup of coffee emit?
A typical cup of coffee emits about 0.28 kg CO2e, with most of that coming from farming and processing rather than transport or packaging.
Is tea always a lower-carbon choice than coffee?
Yes, on average tea emits about 30 times less CO2e per serving than coffee, making it one of the most climate-friendly hot beverages you can choose.
Which beverage stage has the highest carbon impact?
Farming and processing account for over 80% of total emissions for most beverages, making upstream sourcing decisions far more impactful than packaging or transport choices.
How can I lower my drink’s carbon footprint?
Choose plant-based, locally sourced options, minimize dairy add-ins, and use energy-efficient brewing methods to make the biggest dent in your daily beverage emissions.
Recommended
- Sustainable packaging in beverages: eco-conscious guide 2026 – EcoVibe Roast
- Circular economy in beverage: eco guide for coffee & tea – EcoVibe Roast
- Conscious Coffee Drinkers: Eco Impact and Ethics – EcoVibe Roast
- Eco-Friendly Packaging: Impact on Sustainable Living – EcoVibe Roast
- 5 Foods & Beverages to Avoid for Your Heart Health | Garden State Medical Group | Garden State Medical Group


